"Busy" is an app concept that lets you look at historical footfall data for where you're standing (or even where you're not standing). It combines government Open Data along with mobile technology.

Note that the app image above shows real data and percentages based on the Open Data from Leeds City Council.
The Busy concept came about after I spoke to a few local businesses in Leeds. They were relieved to see that things are starting to return to normal again after several COVID-19 lock-downs. So, out of curiosity, I thought I'd take a peek at the local footfall data to see what was happening on the street, and if it correlated with the welcome upturn we're seeing.
Leeds City Council publishes Open Data on footfall traffic in the city. You can download the raw data for yourself. It's pretty cool that there is so much out there, I'd encourage you to browse the datasets. In the case of footfall, it really highlights the impact the pandemic has had on retail, transport and the high street.
Turning data into insight
Just as a test, I imported data from between 19th and 25th April in 2019, 2020 and 2021. Then, using the Google Sheets pivot function, I pivoted that data out into a table that was grouped by street and year. All that was left to do was to create a chart to show this in a meaningful way.
Suddenly the 6,000 data points start to tell a story.
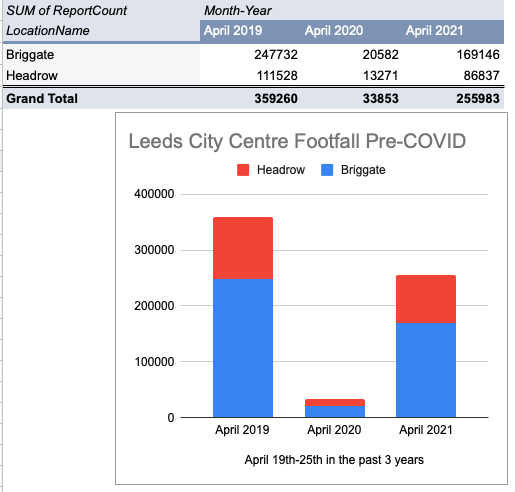
The story is pretty horrific, and not too surprising given what we've been through. I didn't realise that footfall had fallen by 90%, nor that it's bounced back in 2021 to levels close to 2019.
Note that this experiment is just for the same week across 3 years, starting in 2019 when pre-pandemic, and ending a week ago in 2021 (as of the time of writing). This means it covers a normal pre-covid April, then a lock-down April, then a "hopefully coming out of Covid" April where the lockdown was recently lifted.
Turning it into an app concept
For fun, I literally just thought: "Wouldn't it be fun to be able to stand anywhere in Leeds and see how the footfall has changed over time?".
Plus, I'm always trying to think of things to do with open data :)
Admittedly, this is a fairly naff first attempt. A conversation starter. Not a real app.
To create a half-decent app concept, you'd start with curiosity and then go through a series of steps involving research, ideation, testing etc. So, there's no design thinking happening here; no empathy or user research, no ideation or user testing.
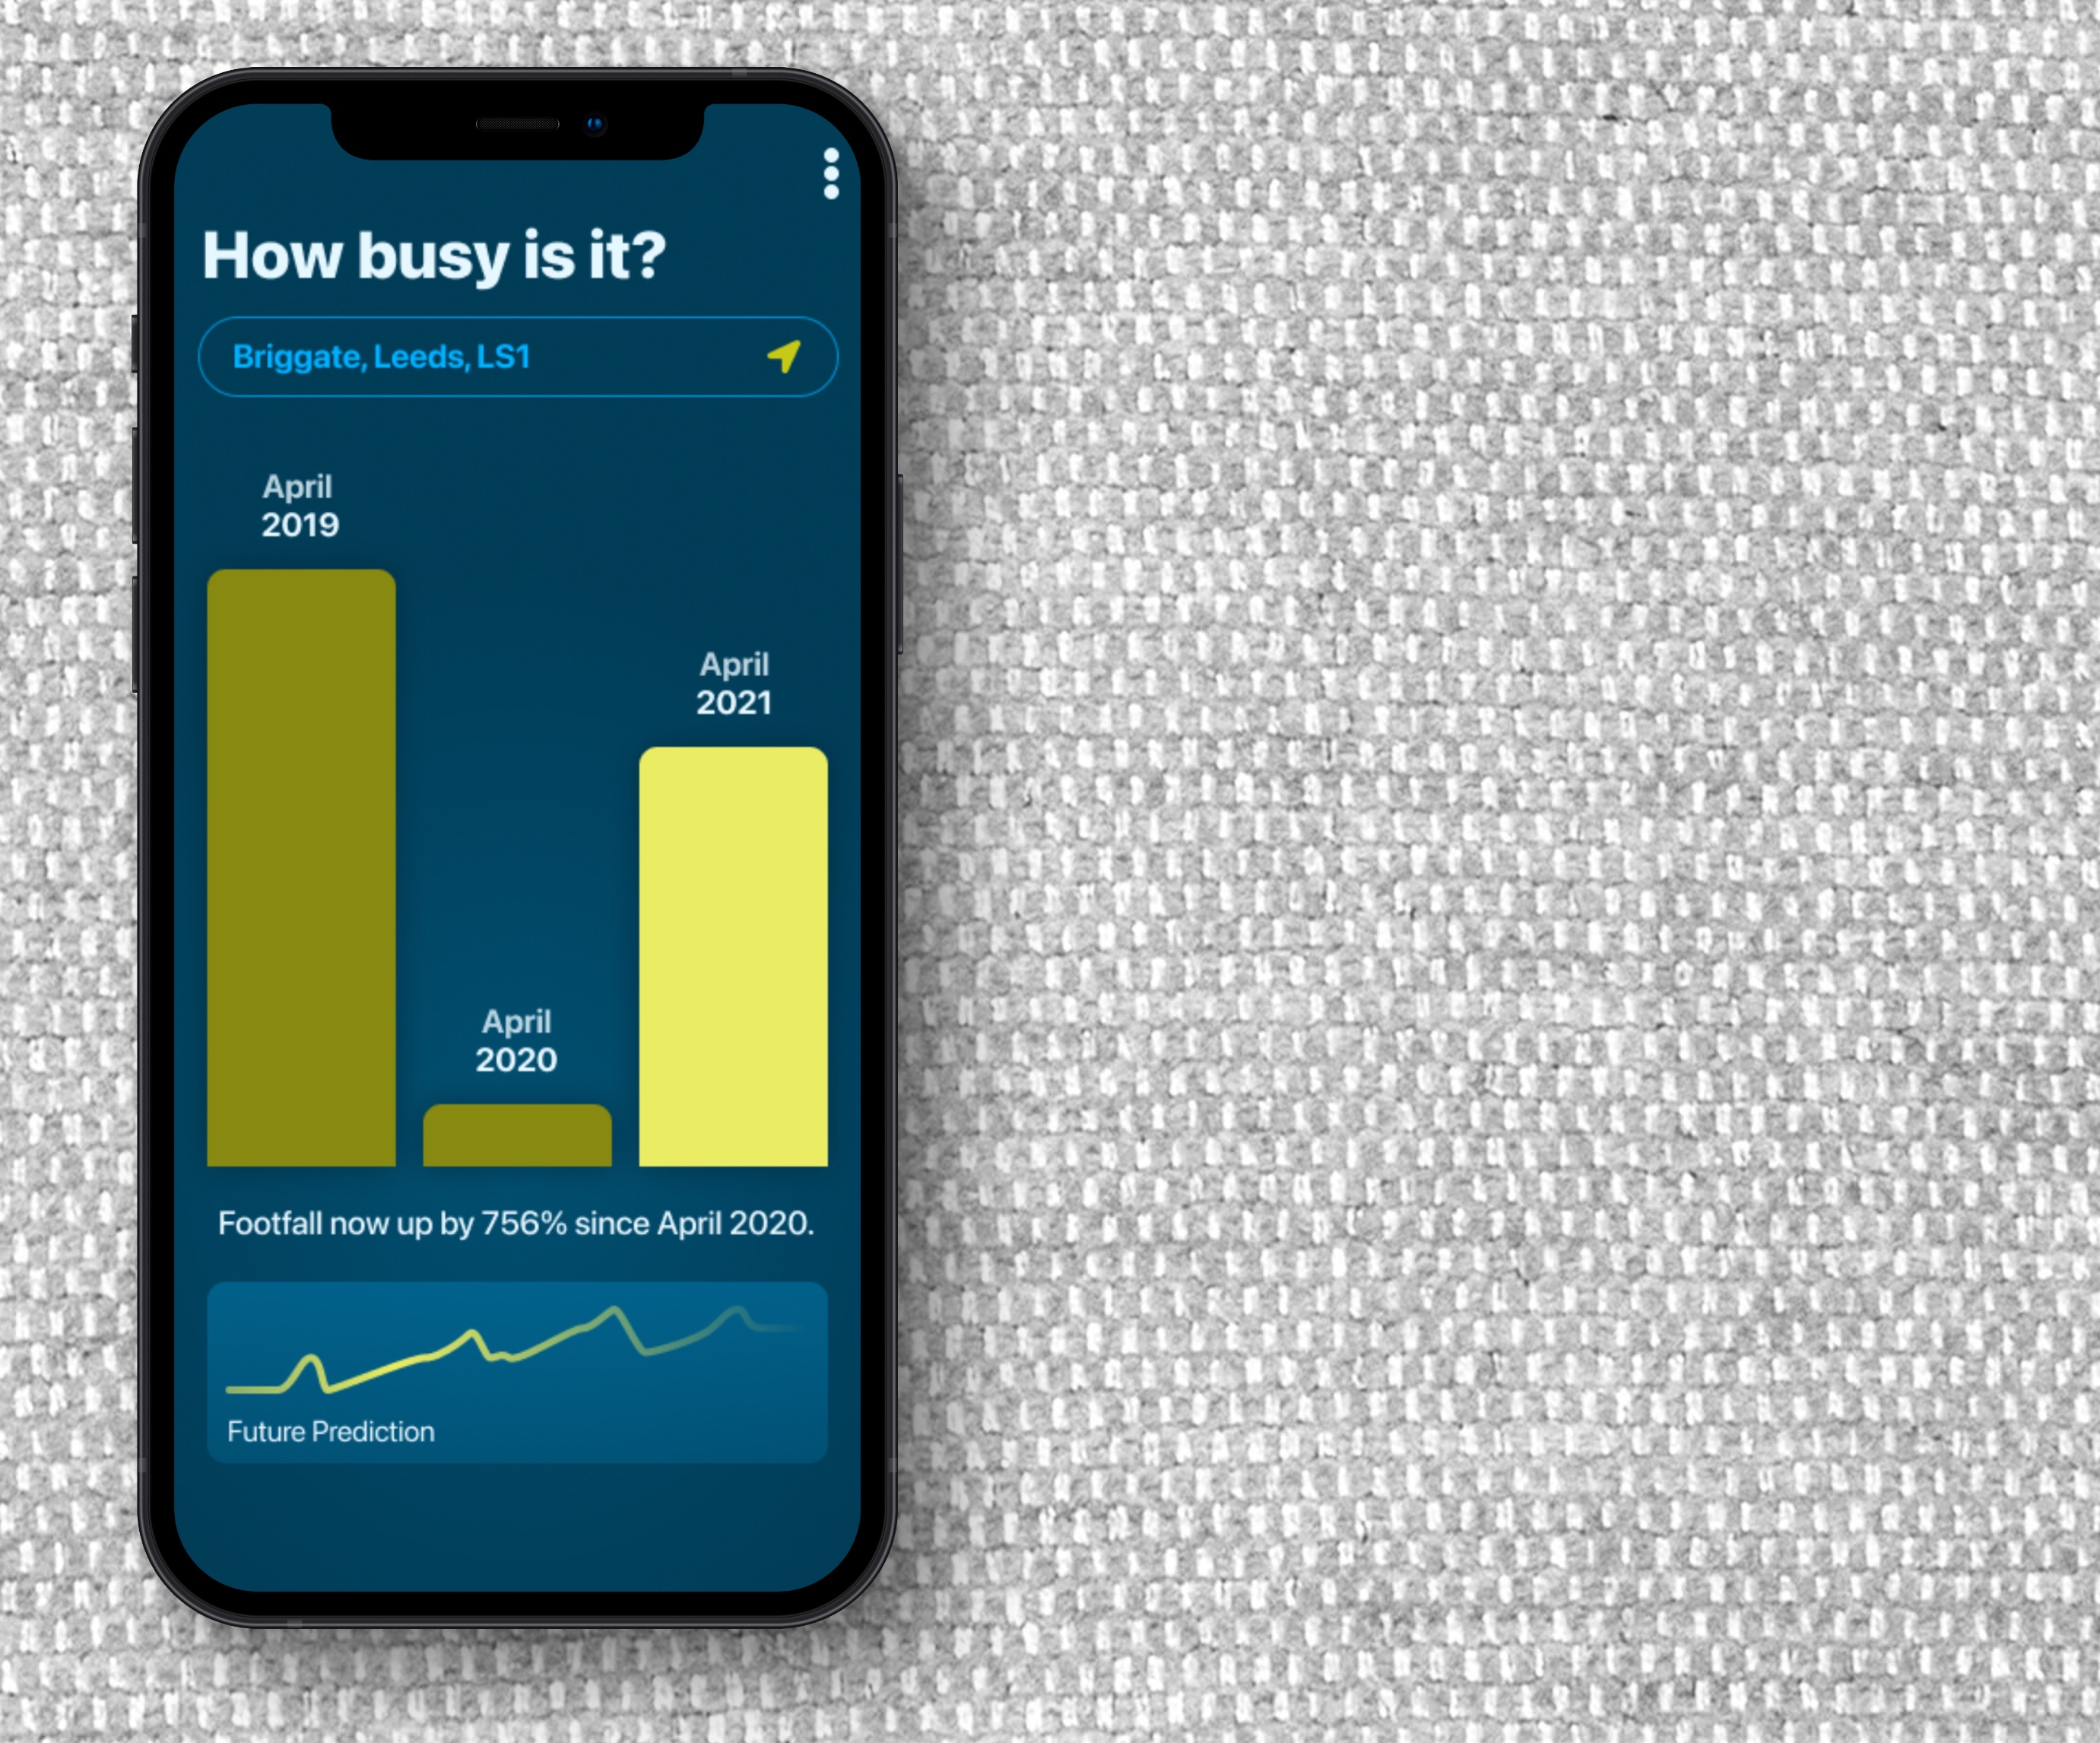
I opened up Figma and knocked out this quick app concept. Technically, it could be a Progressive Web App or even just a web page. But I thought an app gives a slick user experience around GPS location tracking, so it might be for the best.
There's also the idea of using the historical data to train a prediction engine, which might help shops predict future busyness. Given that it's turbulent times as far as footfall is concerned, the prediction engine might need additional data to give reliable insight. For example, social media, local on-premises events and weather forecast might help give a better prediction.
Fun stuff.
Send me a tweet (@tobinharris) or a note on LinkedIn with thoughts.