Launching an app to market is exciting, scary, and daunting in equal measure. You’ve put your blood, sweat, and tears into bringing your idea to life, and you’re finally ready to take it to market.
But how are you going to measure the success of your app? Everyone should be focused on growth, but not everyone on the team knows or agrees with what “growth” really means. Downloads and signups can look good, but retention and engagement might tell a different story.
Your North Star Metric (NSM) is a single data point that tells you if your app delivers user value.
In this post, I’ll explain what a North Star Metric is, how to choose one, and why it’s essential for driving meaningful, sustainable growth in your app.
What is a North Star Metric?
Imagine only needing one single number to understand if your app is moving you toward your business goals? That’s what a North Star metric is; the most critical measure of success for your app or business.
Setting the right NSM can act as a guiding light to align teams, strategy, and performance goals.
While you will want to track dozens of Key Performance Indicators (KPIs), such as installs, retention rates, revenue, trial starts, and conversions, your North Star Metric focuses on the outcome that truly matters: whether users are experiencing your app's core value.
The term is widely attributed to Sean Ellis, who used it during the growth-hacking era of the 2010s to describe the one metric that best represents a product's core value to its users. The North Star Metric framework has since become a popular model adopted by many working in product management and growth.
Examples of North Star Metrics
|
Company |
North Star Metric |
Description |
|
Airbnb |
Nights booked |
This metric captures value for both guests and hosts by measuring successful, completed stays. |
|
Amazon |
Number of purchases per month |
Amazon focuses on the frequency of transactions, which indicates customer loyalty and value generation. |
|
Duolingo |
Daily Active Users (DAUs), learn time, and success rate |
Duolingo uses a set of metrics to track user growth, engagement depth, and learning effectiveness. |
|
Financial Times |
Global Paying Audience (GPA) |
The FT evolved its North Star from engagement to LTV and now to GPA to focus on growing audience revenue across all products. |
|
Netflix |
Total hours viewed (or watch time) |
The focus is on content engagement and consumption to drive retention and reduce churn. |
|
Shopify |
Gross Merchandise Volume (GMV) |
This reflects the total value of goods sold by merchants on the platform, directly aligning with merchant success. |
|
Slack |
Messages sent within the organisation |
This measures internal communication and collaboration, indicating product stickiness and reliance. |
|
Spotify |
Time spent listening |
This metric measures the value customers get from the platform through continuous, enjoyable content consumption. |
|
Uber |
Weekly active riders (or rides booked) |
This tracks the frequency of usage, a key indicator for a ride-sharing service's growth and value. |
The best NSMs balance user value and business value. If your users are finding value, your business grows.
How does a North Star Metric help you measure performance?
Your NSM shows how deeply engaged and satisfied users are with your app. It goes beyond surface-level analytics to answer questions like:
- Are users finding sustained value in the app?
- Are they returning frequently enough to build habits?
- Are your product updates and marketing efforts improving engagement quality, not just the quantity of users?
When your NSM grows, it often signals that your app-market fit is strengthening. It shows that users aren’t just trying out your app but relying on it.
It’s worth noting that sales revenue is rarely used as a North Star Metric. While revenue is the ultimate goal for any app, your NSM should measure the engagement that creates revenue, not the revenue itself. If users are finding value, the money will follow.
How do you benchmark your North Star Metric performance?
There’s no universal way to benchmark your North Star Metric. It very much depends on your app’s purpose (for example, is your app a painkiller, or vitamin?), category, target users, and monetisation model.
However, your goal should be to maximise the percentage of active users who regularly hit that core in-app action.
- For most healthy apps, 20 - 40% of active users performing the NSM strongly indicates product-market fit.
- For highly habitual apps (such as messaging, social/lifestyle, or tracking apps), your NSM can exceed 60 - 70% of active users.
- What matters most is how your NSM grows and trends over time. If it is going up, you're doing something right.
Given that average Day 30 retention across mobile apps sits somewhere between 5-8% of users, delivering value to users quickly is more important than ever.
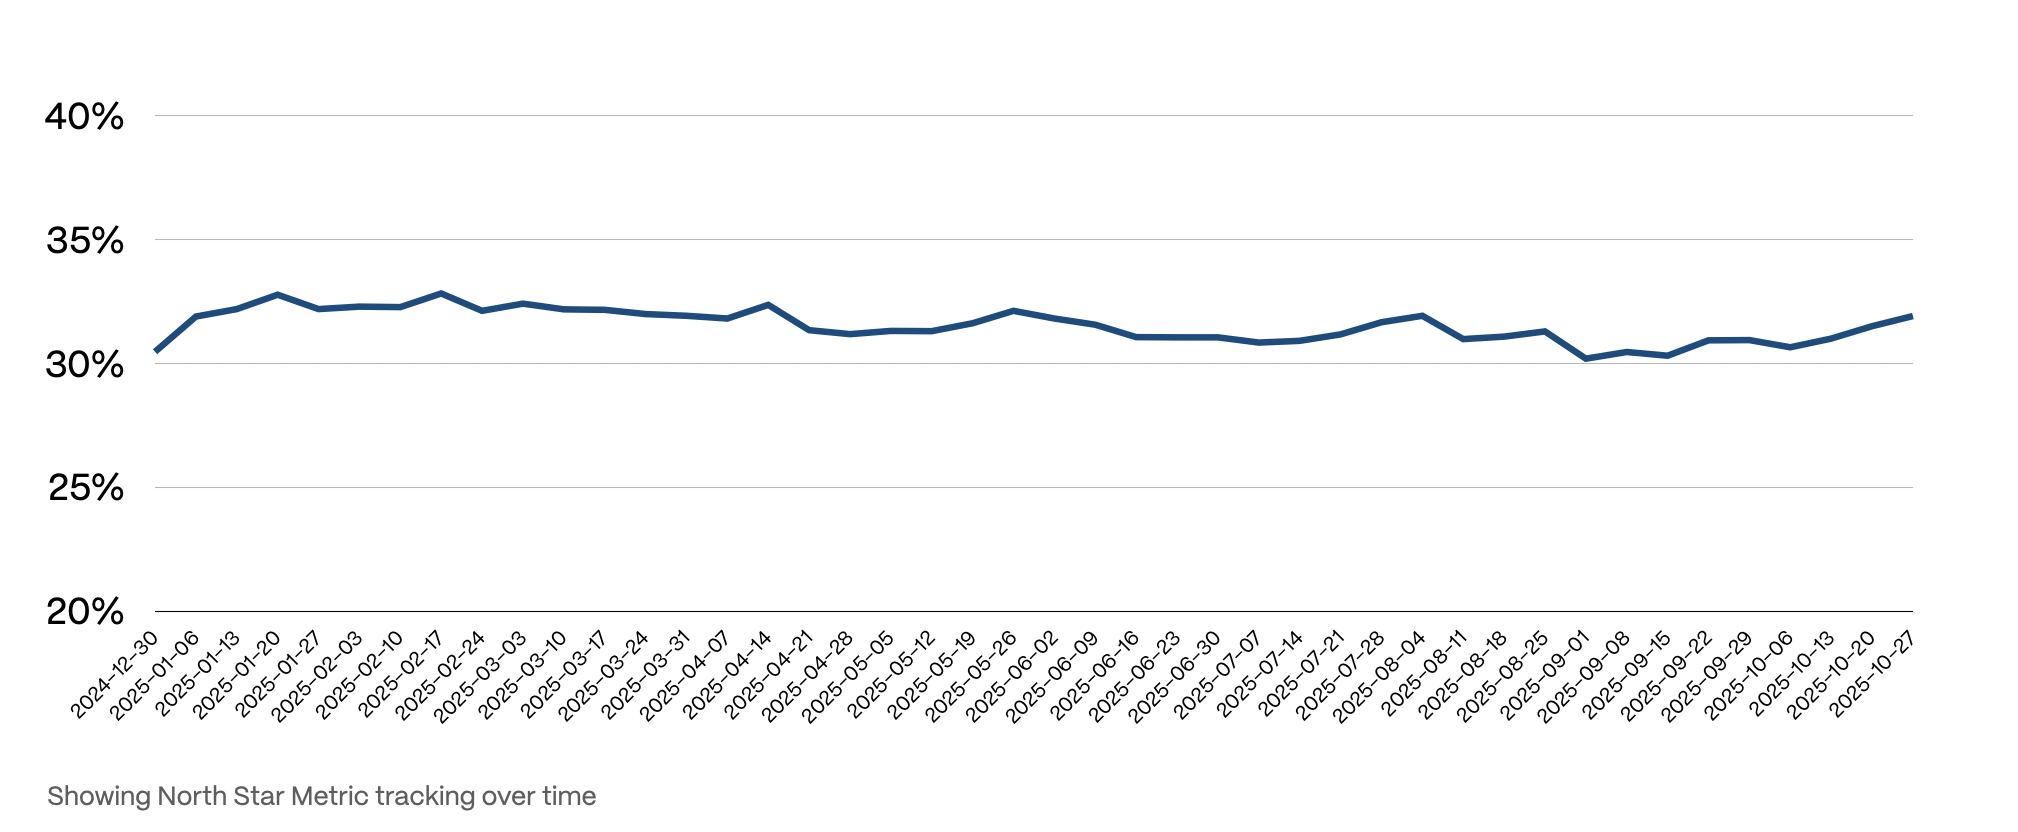
For Carbs & Cals, our North Star Metric is the percentage of users viewing foods within the app at least 8 times per month. This tells us that users understand the app's core function and derive value from looking up the food they’re eating.
On average, 37% of active users hit the NSM in a month. Tracking this number over time helps us identify potential issues. If this number starts to decrease, we can instantly see that engagement might be slowing. Our development roadmap is built around increasing engagement around our North Star Metric.
When we look deeper at our North Star Metric and segment by subscriber groups, we can see that the percentage of our paid subscribers hitting the NSM is much higher than those on the free plan.
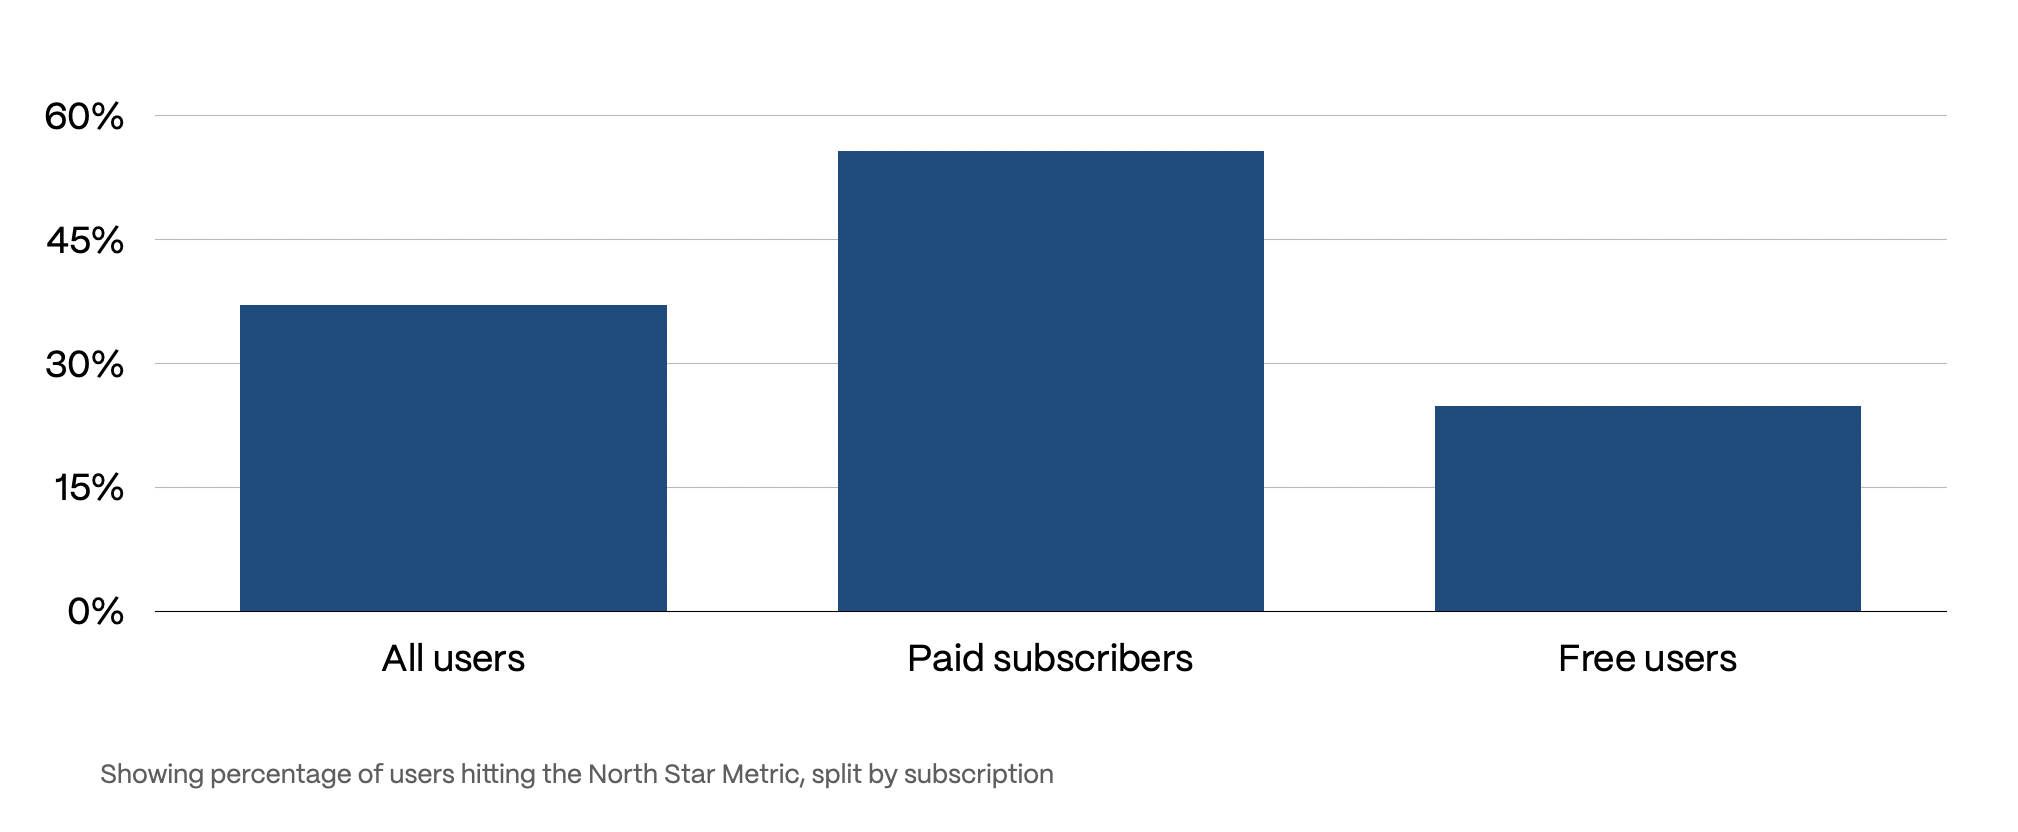
We can then look at our development roadmap from two different angles:
1: Does this help keep paid subscribers engaged and ensure we maintain our NSM?
2: Does this help encourage users on the free plan to engage more with the app and get a higher percentage hitting our NSM?
Features don’t necessarily need to fulfil both criteria, but knowing how your feature will impact and nudge user behaviour is helpful. Paying subscribers need to be nourished with features that make life easier and the app more delightful. Users on the free plan must get to that “ah-ha” moment to experience your app’s core function. They will then be far more likely to upgrade to a paid subscription.
The idea is to track what represents lasting engagement and real value to users, rather than vanity metrics like downloads or active sessions.